 GLOBAL CITIES • GLOBAL CITIES • • Method 1
Stage 1 - Introduction: presenting the documents
Similarities: Both documents deal with the prosperity of London, so on a local scale, the capital city of the UK, a dvped country.
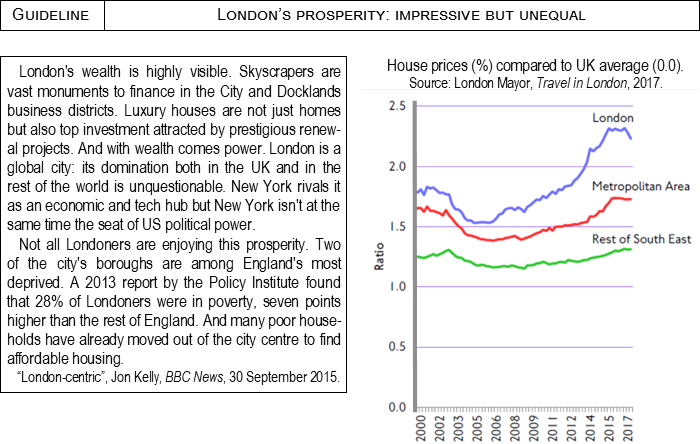
Differences: The 1st doc is an article about/entitled London-centric by Jon Kelly and published by/on BBC News on 30 September 2015 whereas the 2nd doc is a line graph (other graphs: bar graph & circular graph) comparing house prices by the Mayor of London and published in Travel in London in 2017.
Give structure: In a 1st part I’ll focus on London’s impressive prosperity with the 1st paragraph of the article & in a 2nd part I’ll analyse its inequalities with the 2nd paragraph of the article & the graph.
Stage 2 - Analysing the documents
| DESCRIBING - What you see (docs) |
INTERPRETING - What you know (notions) |
| 1. An impressive prosperity (article §1) |
|
|
Wealth: impressive skyline, 2 financial centres, affluent housing to live in and invest thanks to regeneration |
2 business districts (def), super-gentrification (def), urban renewal (def) |
| 2. But an unequal city (article §2 + line graph) |
|
Article P2 Poverty for over a quarter of the pop which is higher than UK, with UK’s 2 most deprived boroughs => have to move out of city centre because too expensive (see graph) |
Polarised city (def), deprivation (def) |
Stage 3 - Concluding
Assess docs: To conclude, these documents are reliable as we have their full references and both are unbiased: the article is balanced (+ & -) and the graph shows facts, figures..
Sum-up ideas: These documents show that, although London is the most powerful city of the UK, economically & politically, it is also the most unequal city of the country.
Open: We may wonder if the situation is similar in another global city like New York.